News
Spotlight – Multispectral surveying
A look at our multispectral UAS and how we use the data
In our experience, the most common issue is this type of data is very hard to visualise. While soil and ecology reports will be extremely detailed and comprehensive, they don’t usually lend themselves well to answering the question “what have we got?” and that is where a multispectral survey helps as it will present a visual model which shows how healthy the vegetation is, and it covers the entire survey area not just where the samples were taken from.
When used in conjunction with soil sampling and traditional walkover ecology surveys, multispectral surveys provide a complete approach to managing crops, planning crop rotation, pre-construction development of landscaping schemes, or routine maintenance of greenspaces.
What is a multispectral survey?
Originally developed for the agricultural sector, multispectral surveying provides a visualisation of soil and vegetation health and quality. It isn’t a replacement for proper soil sampling and ecology surveys, but when used to accompany them it can provide a much fuller picture. A by-product of this type of survey is it can detect anomalies under the surface which has lead to archaeological findings and the location of underground obstructions well in advance of work taking place. (we will examine this in another case study)
How does it work?
The UAS has two main sensors, one is an RGB camera which detects the visible spectrum to provide photogrammetry data for us mere humans to have a base reference of the reconstructed data model. The other, the multispectral camera, is comprised of four smaller sensors that detect specific wavelength ranges – these ranges are known as spectral bands, which is where the term “multispectral” is derived.
The four sensors on the multispectral camera detect light in the Near-infrared [NIR], Red edge [RE], Red, and Green wavelengths and by measuring the reflectivity of the vegetation in those bands we can “see” the relative health and condition of the vegetation being surveyed, and thus the quality of the soil.
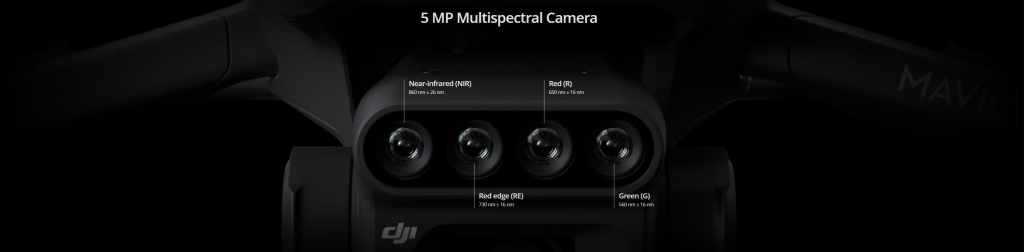
– image courtesy of DJI
When the UAS takes a photo it is in fact taking five, the first is with the visible light camera, the next four are with each of the individual sensors on the multispectral array. If you look at these photos individually they look black and white, which is why we run them through a modelling programme which layers them and extracts the data needed to present it as a viewable model. Each time it takes a photo the UAS records its location so that when the model is being constructed, the software knows where each photo exists on the model so it can produce a cohesive map.
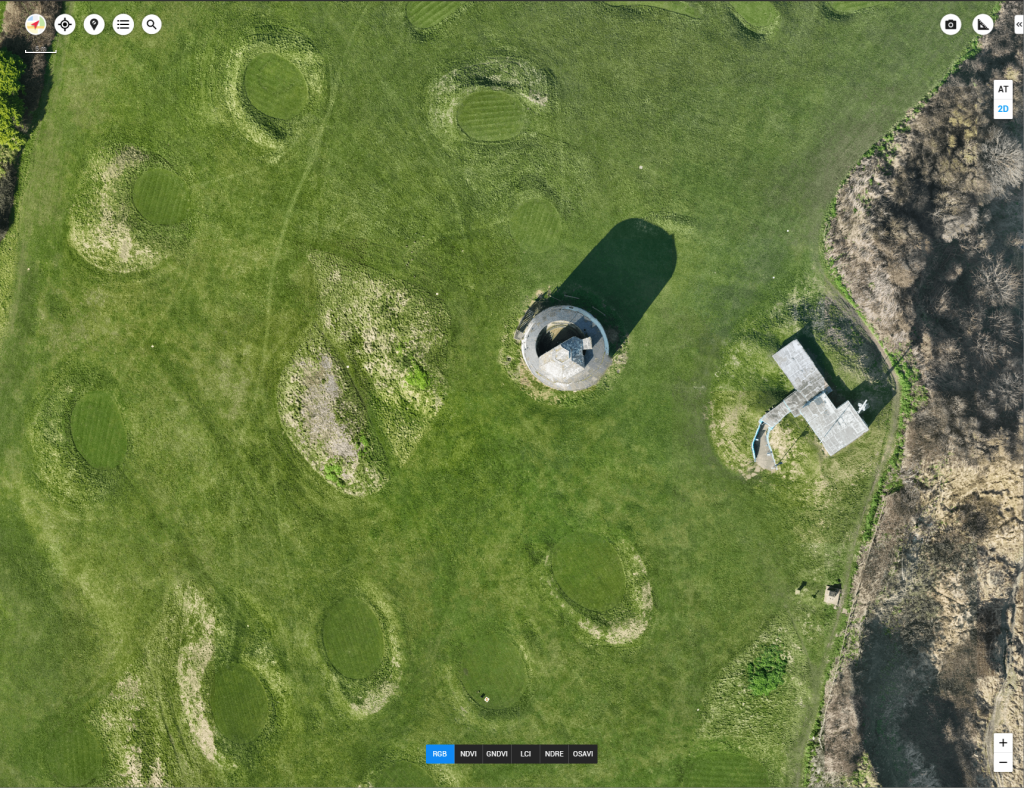
The photos provide us with six different overlays and image data as shown below:
What are we looking for?
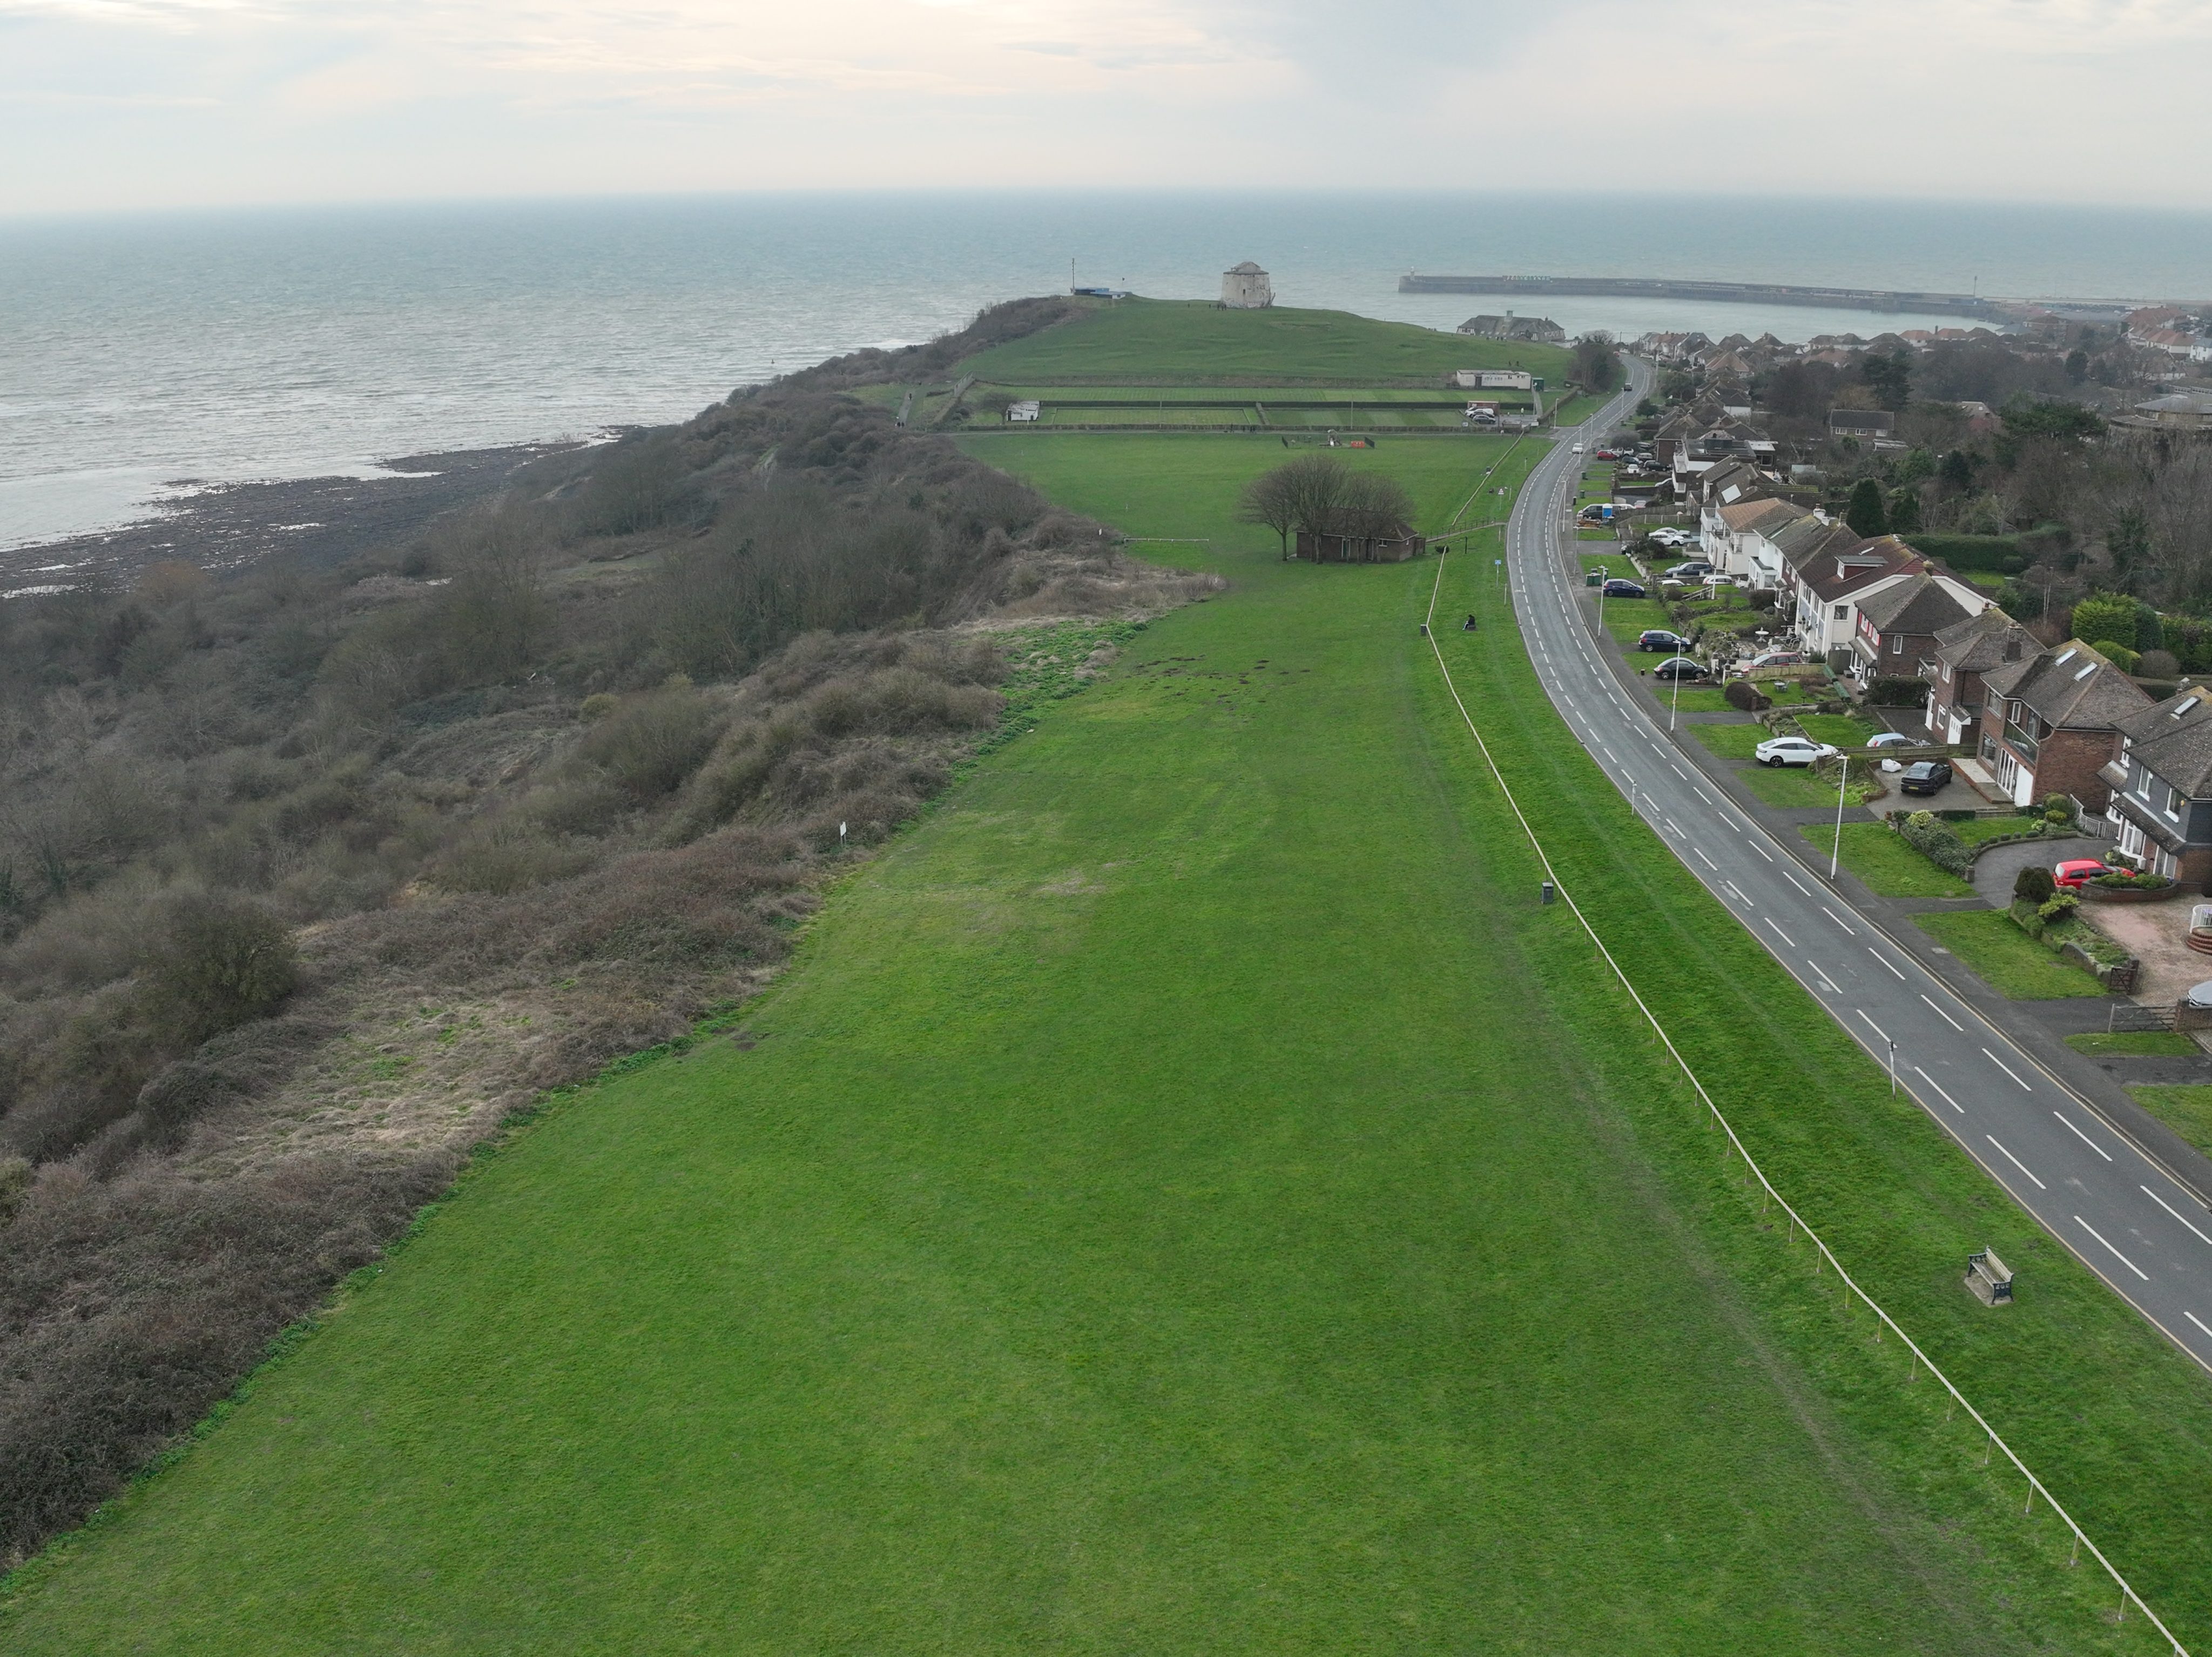
When reviewing the model, we always start with the RGB camera image as it gives us the opportunity to look for features or landmarks which we want to disregard or focus on depending on the objective of the survey. In the images above you will note the Martello tower is casting a shadow, and this has affected the multispectral images by reducing the reflectivity of the grass in the shadow.
Without the RGB image it may not be immediately apparent that a shadow is being cast and this could affect how the data is interpreted, as it is, we know there is a shadow and can now make calculated assumptions about the quality of the soil and health of the grass. If this were a critical area we may also reschedule a further survey at a different time of day and produce a blended model which removes the shadow.
How does it work?
The five multispectral overlays give us an insight to the following:
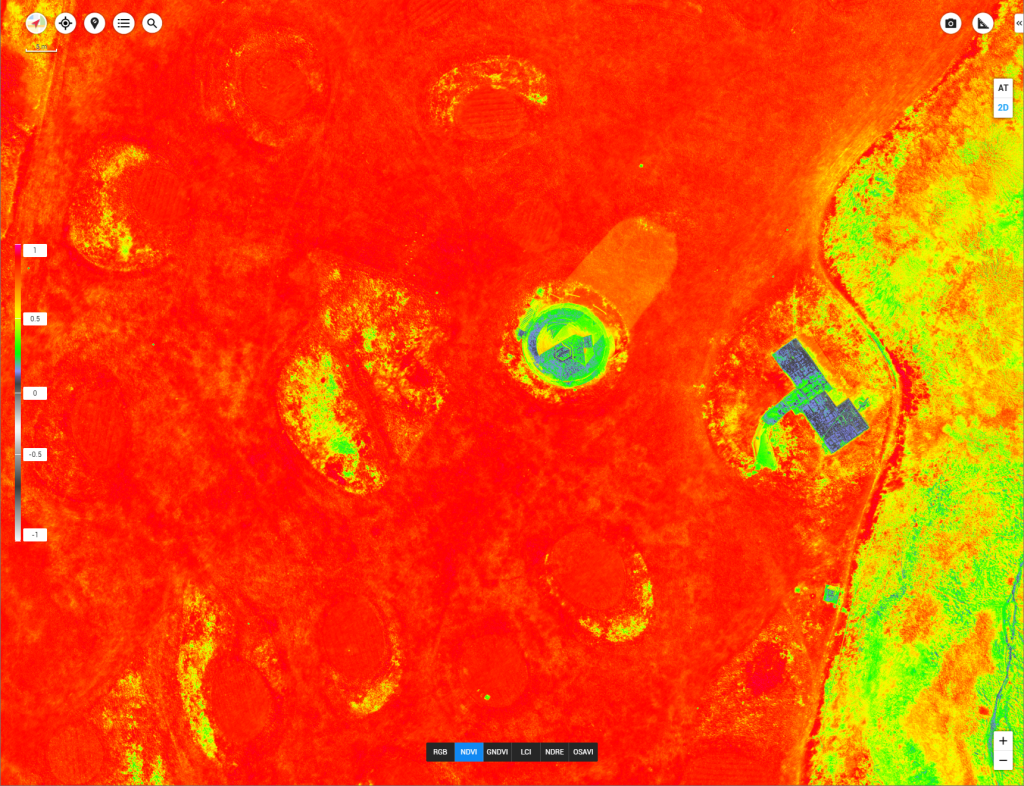
- Normalised Differential Vegetation Index [NVDI] – Uses the NIR and Red sensors to visualise the health of vegetation by measuring the difference between the Near-infrared light reflected by the vegetation and the red light absorbed by the vegetation.
Healthy vegetation reflects more NIR and green light and absorbs more red and blue light. The general rule is, the more red in the image, the denser the vegetation. If there is a lot of green or blue in the image it may be an indicator of a built environment such as buildings, footpaths, or roads. Grey scale and negative values are attributed to surface water.
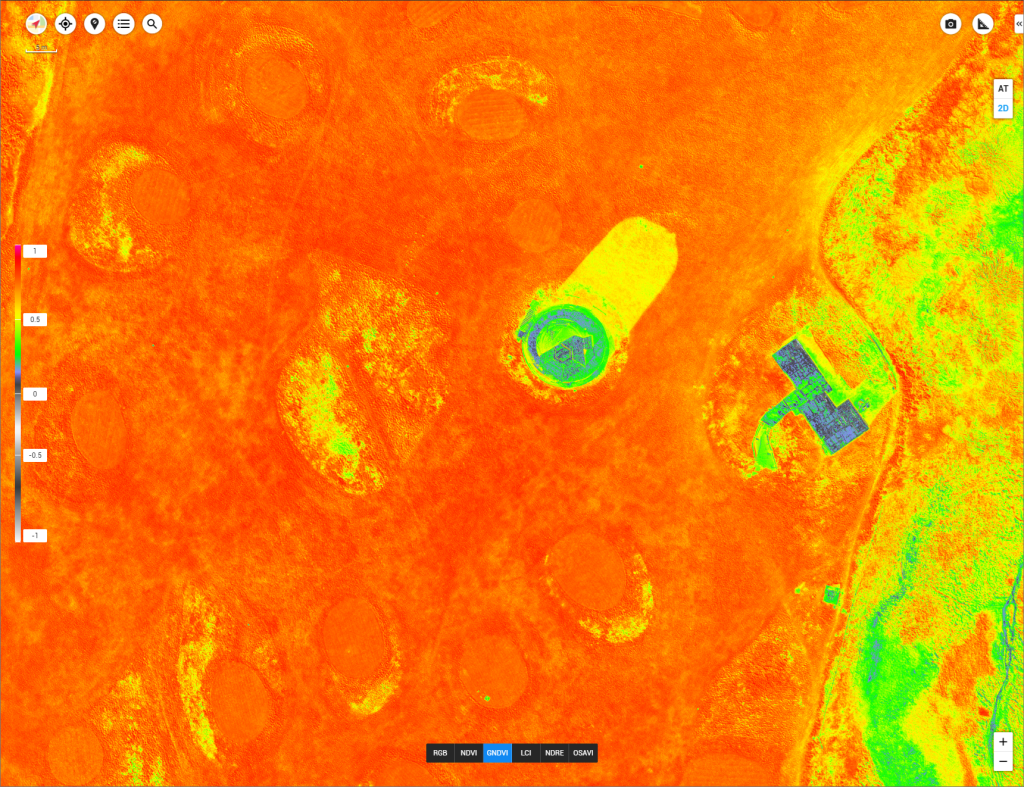
- Green Normalised Differential Index [GNVDI] – Uses the NIR and Green sensors to visualise photosynthetic activity or “greenness” of the vegetation. It is a measure to determine the amount of water and nitrogen uptake in the leaves.
As with the NVDI, the more red on the image, the more photosynthetic activity and, as a general trend, the better balance of nitrogen and water in the soil. As with the NVDI, green and blue on the image represent a built environment, while greyscale represents bare soil or surface water.
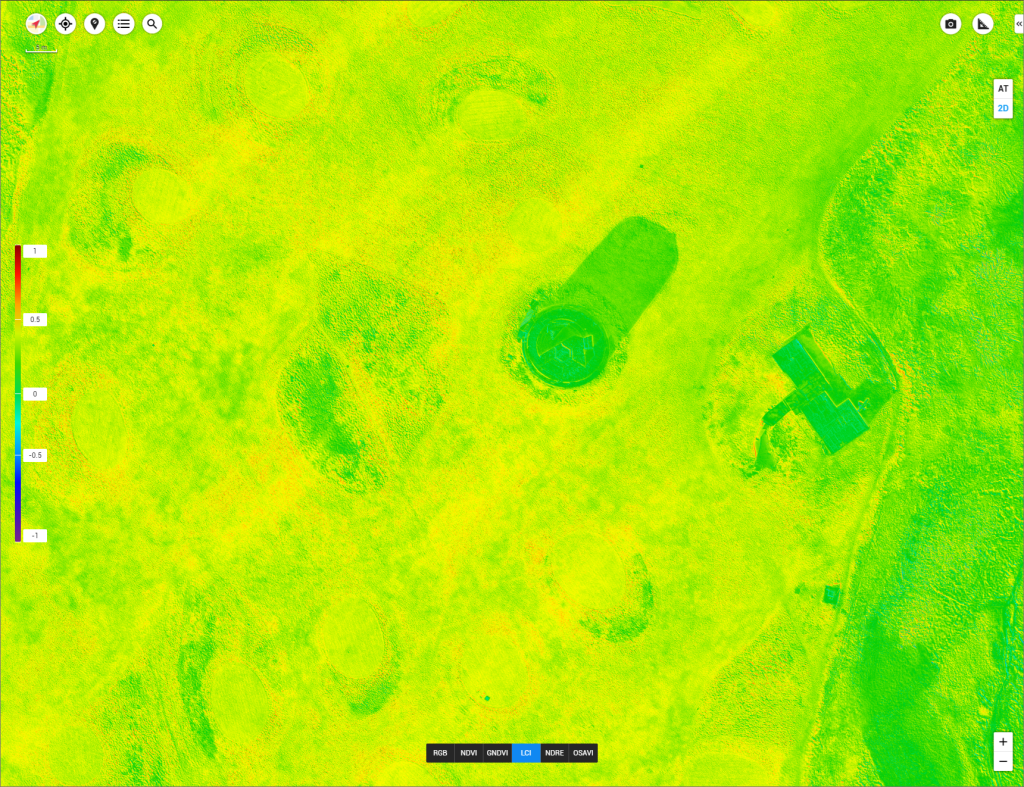
- Leaf Chlorophyll Index [LCI] (sometimes Green Chlorophyll Index [GCI]) – Uses the NIR and Red Edge sensors to provide a visual model of the amount of chlorophyll in the leaves of plants. The Red Edge sensor is very sensitive to light reflected back from the vegetation.
This imagery gives a greater precision of overall health than just relying on the NVDI because the sensors used to determine the NVDI can become oversaturated if presented with dense biomass, giving a false representation of health. As with the previous two indexes the scale is from +1 to -1 but in the case of LCI the colour scale goes from red to purple with green sitting in the middle at the zero point. Anything registering zero or below is either barren earth, surface water, or made ground like footpaths or roads.
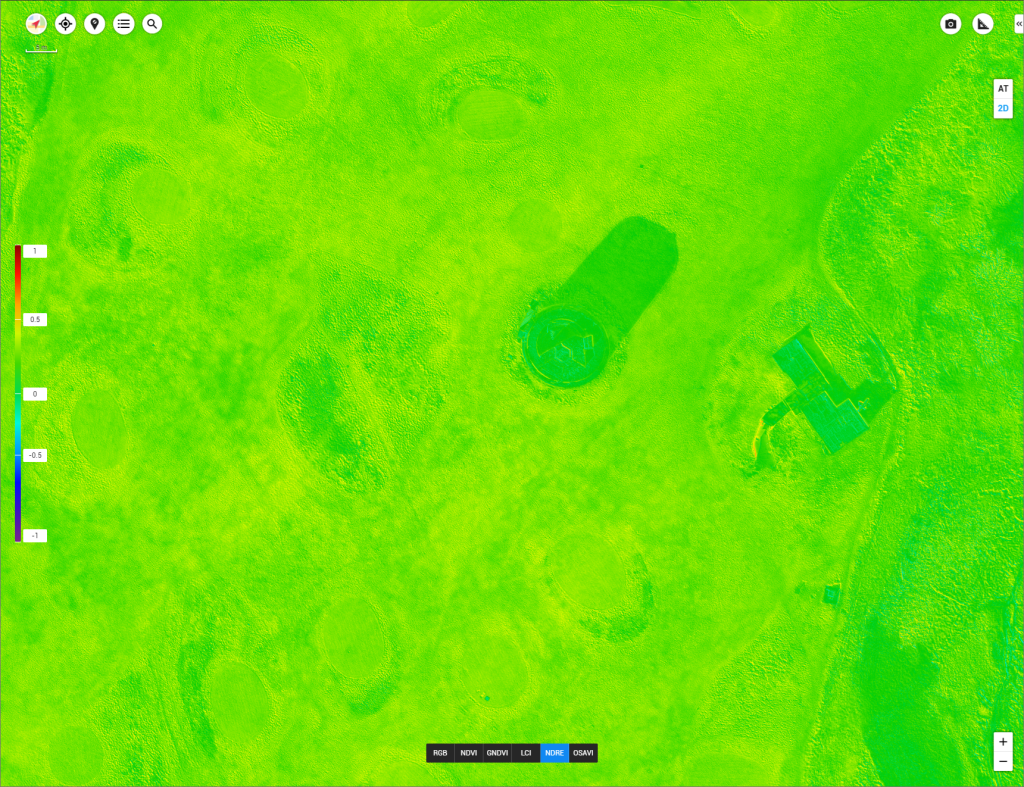
- Normalised Difference Red Edge [NDRE] – This image layer also uses the NIR and Red Edge sensors to provide the same data as the LCI. However the difference is in the ability to penetrate vegetation mass and the NDRE model is used primarily for agriculture in the advanced stages of a crop’s growth cycle.
We use the NDRE to assist farmers with planning their nitrogen fertilising routines by generating heat maps that show where fertilisation is most needed. The scale is the same as the LCI but the penetration depth of this index is higher, so if used anywhere else than on arable farmland or managed forests the majority of the readings will return just above zero.
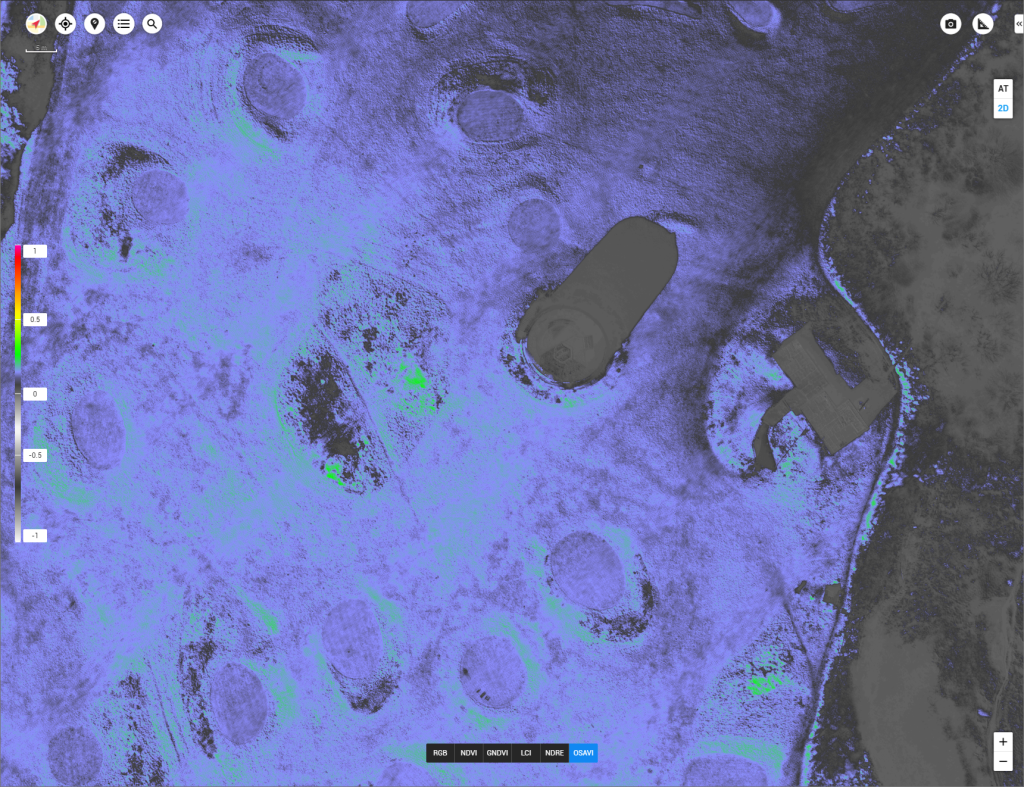
- Optimised Soil Adjusted Vegetation Index [OSAVI] – As with the NVDI this layer uses the NIR and Red sensors but applies an adjustment factor to account for any tree canopy cover and is useful when surveying areas with more than 50% canopy cover such as orchards or managed forests.
We have provided an example image in this case study as a reference, however we wouldn’t typically use the OSAVI for measuring the health of grasses or open spaces as it is trying to adjust for a large amount of tree canopy cover as a means of filtering out false readings from biomass concentrations or reflectivity from the leaves of trees
What do we use it for?
Primarily we use it in the agricultural and forestry sectors to direct our clients’ planting and maintenance routines. Multiple surveys will be taken over the course of the year to provide a long-term view of crop and tree health, and underlying soil quality. Whereas in the past a blanket or “wait and see” approach would be taken to crop health. The data we provide helps our clients direct their resources proactively which saves time, reduces costs of materials and manpower, and increases yields.
Other more nuanced uses are:
- Comparisons before and after construction projects to ensure the finished landscaping works will hold, and are healthy and balanced within their new environment. This can lead to a reduction in return visits for snagging, or as to verify the quality of your contractor’s workmanship during close out.
- Detection of sub-surface features such as underground utilities or items of archaeological interest such as ring ditches, buried walls etc to enable you to plan works more efficiently and reduce the likelihood of accidental strikes against underground utilities or disturbing archaeological artefacts.
We invite you to contact us to discuss any future projects we may be able to assist you with and improve your forward planning to reduce time and costs, while improving returns.